|
|
|
Petr Krysl and Abhishek Trivedi
Humans produce sound in the marine environment for various reasons, for instance to explore for oil, to search for ships, or to conduct scientific experiments. The past two decades witnessed several strandings of beaked whales on beaches around the world. It has been conjectured that the U.S. Navy use of high-intensity sound generated by active sonar is perhaps causally related to these occurrences, since Navy exercises including the use of the sonar preceded these strandings.
The U.S. Navy Office of Naval Research sponsors scientific investigations of the impact of high-intensity sound on marine mammals at several institutions in the US. One of them is the Scripps Institute of Oceanography where a project headed by Professor John Hildebrand (UCSD/SIO) aims to understand the relationship between human generated sound in the marine environment and beaked whales. This research program has a very strong experimental component, which has successfully generated digital models of the anatomy of a beaked whale, and has identified mechanical parameters of the biological tissues in the organs of a beaked whale. For the computational part of this program, the project enrolled the expertise of professor Petr Krysl from the Department of Structural Engineering and his student, Abhishek Trivedi.
|
|
|
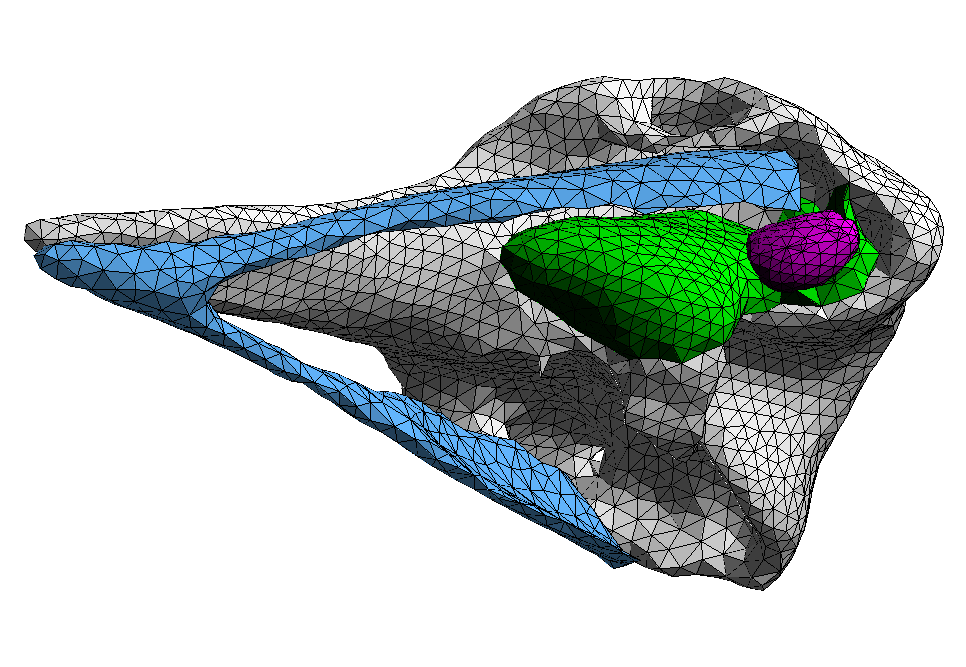
Table 1 Surface model of major interfaces between materials. Light gray: skull; steel blue: mandible; green: interface between air and tissue; Violet: ear bone. Note: only the left-hand side pterygoid sinus and earcomplex are shown.
Current computational effort strives to address the hypothesis that high intensity sound at about the frequencies of the active sonar, 1-- 3 kHz, produces resonances in the tissues surrounding a large air-filled void, the so-called pterygoid sinus.This void contributes to the functioning of the sound detection system, and probably also serves to isolate the ears. It is surrounded by blood suffused tissue, and it is immediately adjacent to the ear complex. As a first step, the resonant frequencies and the associated mode shapes needs to be identified by a free vibration analysis.
The three-dimensional volume data had been segmented by the team of Dr. Ted Cranford of SDSU. The technique of adaptive deformation then produced surfaces bounding bones and voids. The GNU GTS triangulation library has been used to coarsen and smooth the surfaces. The extraction tool, BESS, by P. Krysl merged the surfaces into a consistent boundary representation (see table 1). The boundary representation was then used by an automatic tetrahedral mesh generation tool, VDT (Krysl, Ortiz 1999) to define a computational mesh.
To reduce the problem of vibration of the biological structure in interaction with the surrounding fluid, the assumption had been made that the mode shapes and frequencies of the material surrounding the sinus were only weekly affected by tissue outside its immediate vicinity, and that the left and right sinuses could be considered in isolation. Therefore, the interface surfaces around the left sinus were simply embedded in a block of tyesissue, with zero-displacement boundary condition on the boundary of the block. In the initial stages it was assumed that the tissues were a generic homogeneous isotropic, linearly elastic, almost incompressible material. Discretization into quadratic tetrahedral elements was used to mitigate the problem of volumetric locking.
The matrix general eigenvalue problem was then solved with a subspace iteration technique implemented in the adaptive finite element framework FAMULS (Krysl 2000). Shifts have been applied to extract a few eigenvalues in the neighborhood of prespecified frequencies, 0 Hz, 500 Hz, etc. Table 2 lists two animations of the free vibration motion for two selected frequencies. It can be seen that the motion consists essentially of sloshing (shearing) of tissue near the sinus.
|
|
|
Table 2 Animations of mode shapes. The displacement magnitude is color-coded, with values increasing from violet, blue to yellow, orange and red.
Getting the frequencies accurately is tough for several reasons. The subspace iteration algorithm is capable of solving the shifted eigenvalue problem, but is memory intensive which limits the available resolution. On the other hand, the resolution required for accurate solution grows dramatically for higher frequencies, because the mode shape patterns are associated with increasingly smaller wavelengths.Work aimed at increasing the resolution with advanced high-performance solvers on parallel architectures and adaptive algorithms is currently ongoing.